Week 3 #dalmooc assignment – Twitter vs Blogs in CCK11 SNA in Gephi

Interpreting SNA feels like telling "just so" stories about how leopard got its spots. Or is it just me:)
Interpreting SNA feels like telling “just so” stories about how leopard got its spots. Or is it just me:)

Time to bring the week 3 exercises (Gephi SNA part 1 and part 2) together for week 3 assessment, asking us to “compare the two networks (Twitter vs. blogs) for week 12 of CCK11” (for description of the data set see part 1).

Health warning – this is a rather an amateurish effort and felt more like telling stories than drawing hard conclusions. But – hey – from what I have seen so far much SNA stuff is very much about “just so stories” and rather overimaginative interpretation of patterns and associations. If you were to believe the rumours, such approach should be a familiar territory for an evolutionary biologist like me…and so the process made me feel almost at home;)

Density and centrality measures

Twitter network had slightly lower density but slightly higher average degree than the blog network (0.001 vs 0.03; 2.7 vs 2.01).

Density was quite low in both networks, pointing to low level of overall community integration and low potential for spread of information. However, it seems that blog network would have a marginal advantage over Twitter here.

Low density indicates that using either system for important announcements would be inefficient. Participants or subgroups may feel isolated from the others and may find it difficult to find relevant information or connections. The slight differences in density and centrality may be a result of the inherent properties of the two tools. Twitter is inherently easier to use for quick communication and making connections due to the low level of effort required to post in comparison to blogs. The latter allows for more in depth exchanges.

But I immediately want to ask – what were the course team strategies for use of the two communication tools? Did these strategies have an impact on the network characteristics? Did they override or aide the influence of the tool affordances?

Broker and central node overlap

Identify any any overlap in the main brokers and central nodes across the two networks?

What does it mean to have brokers and central nodes in common for both networks?

If you haven’t identified central nodes in common for the both networks, what does it mean in terms of integration of different social media used in a single course?

Now – I had fun with this one (and of course spent disproportionately too much time on wrangling the data and the software into semi-submission). As formal analysis for this type of question was not covered in the lectures, I assumed that identification of “any overlap in the main brokers and central nodes across the two networks” was to be done by eyeballing alone.

OK – so I discovered that the unique id for each participant was coded in the label column within Data Lab.

I could display Labels on nodes with highest betweeness scores (the brokers) and highest centrality scores in visualisation of each network and simply check if they are the same.

But anonimisation meant that the identifiers were long strings of alphanumerics. Not so easy to eyeball and compare for multiple brokers and central nodes then. Especially, that Gephi does not support side-by side display of the network plots! Wouldn’t it be nice if on highlighting a node with a particular ID (or in this case Label) in one network it would get highlighted it in the second one?

OK – another idea was to dump both datasets in Excel and then use simple sort by value of betweenness and centrality and check if there are any nodes in common among the highest values. Notwithstanding the issue of comparison of long strings by eye, this would definitely loose the power of visualisation in presentation of my conclusions.

Ideally, I would want to display the nodes shared between the two networks within each diagram. Even more ideally, I would like to heatmap betweeness of the second network on the first one where nodes were sized according to the same measure. I would simply have to import the values for the second network into the Data Lab spreadsheet of the first one and use them for node colours!

This did not turn out to be as easy as it sounded….mostly because of idiosyncrasies of Gephi  (oh the joys of hands on problem-based discovery of new software!). This is what I did to produce a heatmap of blogger betweenness onto the Twitter network (and it does sounds soo basic when you put it down like this):

1.  I exported spreadheet of Twitter and blog network from Gephi Data Lab.

2. I joined the two in Tableau with left hand join (i.e. all Twitter nodes were preserved and data added only for the blog nodes which occurred in BOTH networks).  Making sure that the join was on Label (unique ID for each participant).

3. Selected the whole joined data table in Tableau and copied into Excel.

4. In Excel I deleted all the columns corresponding to the Twitter data (except from the Label in order to cross check IDs after import to Gephi). I also replaced all the nulls in the missing blog data with -40. Replacement was necessary as Gephi does not recognise columns with empty cells as valid for visualisation, and you cannot use letters as it misclassifies the data. I chose value of -40 as this was not a real value and was low enough to be able to select a cut off when colouring the nodes. Horrible hack I know! Saved as csv.

5. Imported spreadsheet into Gephi’s existing Data Lab spreadsheet for Twitter. Surprise, surprise, had to change data types for the imported columns (during the import!). It turns out that Degree, Component ID and Modularity Class are integers, but Eccentricity, Closeness and Betweenness are double. Don’t ask how I figured it out!

6. Now I sized the nodes of the Twitter network on Twitter network betweenness, and used betweenness values for blog network to colour the nodes (placing cut off point above -40 and as close as I could get it to +1ish). Here is the pretty picture:

TwitterBlogsBetweennessCentrality
Twitter network in CCK11 MOOC with nodes sized for betweenness centrality within Twitter network. Node colour corresponds to betweenness centrality of the node in the blog network. Dark blue=highest, light blue=lowest, yellow=nodes not shared between the two networks.


Now – all this fiddling did not leave much time for interpretation. (I also did not have time to do the same for blogs or centrality)

But here goes.

62/194 (32%) of participants who either blogged or commented on blogs also tweeted using the course hashtag. This indicates that at least some participants actively communicating via online social networks, tended to use more than one network. The bloggers were more likely to use both (32% of bloggers overlapping vs 7% of Twitter users). This is not surprising, since Twitter is often used to advertise new blog posts by bloggers and many Twitter participants would visit and comment on those blogs. Tweeting is much less demanding in terms of time and effort, hence majority of participants chose to only Tweet.

Now to the brokers. It appears that the participants with the highest betweenness centrality within Twitter did not have the highest betwenness in the blog network. There were 2 or 3 exceptions for slightly lower values – shown in mid-green within the figure.

Without knowing more about the nodes it is difficult to draw any meaningful conclusions. One conclusion may be that nodes with high centrality and betweenness on Twitter are in fact course coordinators who try to engage in exchanges with wide range of participants and retweet their contributions to spread their ideas to their own networks. It is not common for course leaders to also blog extensively, hence they would not have a similar position in the blog network.

A couple of participants with relatively high centrality in two networks may be course leaders who engaged in extensive commentary on multiple blogs. Or course participants whose communication strategy was similar within both networks.

Not really possible to confirm this without knowing more about the nodes here…

Either way – I like the idea of having different “dominant” nodes in different social spaces. It allows for greater diversity of conversation across them. For example, if Twitter was in fact course leader-centric, blogs would be providing a more student-led environment. It would really be interesting to see what the course organisers envisaged for these spaces!

And can we really make any conclusions without seeing the lurkers – followers who do not comment or retweet. Excluding them from the analysis instantly devalues the act of witnessing or reading as an invalid form of interaction and learning. And yet the lurking rule of thumb seems pretty invariable across various media. I wonder how lurkers with high betweenness centrality measure up to active communicators on the creativity and innovation scales;)

Communities

Compare the number of the communities across the two networks and check if there are some potential similarities;

Try to provide interpretation for the findings

What implications can you draw based on the modularity analysis and the communities identified in the two networks?

OK – I think I run out of steam here. Twitter has many more communities as measured by modularity analysis as described here (12 for Twitter and 6 for blogs on default settings). I suspect this has to do more with the relative size of the two networks but I may be wrong. It is also possible that the blog community network is a reflection of a few bloggers receiving many comments on their posts this week. In this case each blog post would form a mini-community hub. Again – hard to check this without having more insight into the data.

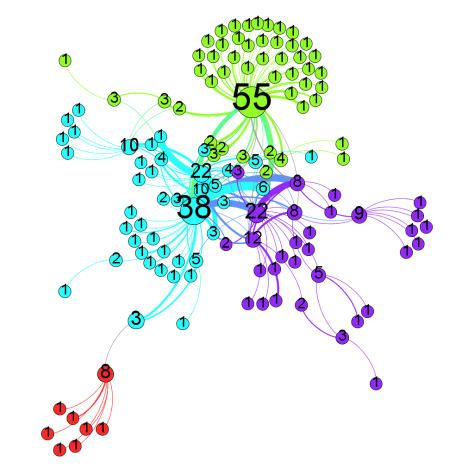
In terms of overlap in communities for Twitter and blogs – I would say there is very little evidence of this. I used the combined dataset as per description above to get this pretty picture.
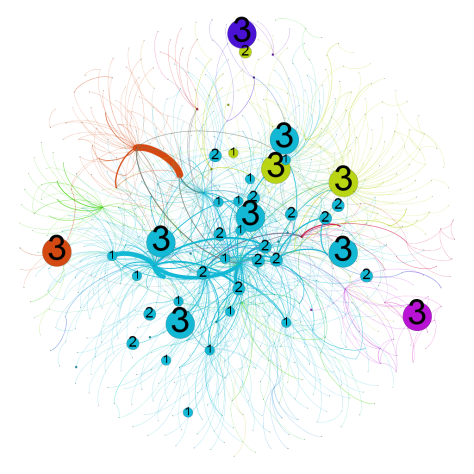
Overlap between Twitter and blog communities in CCK11. Colours=Twitter communities, size + numbers = blog communities of shared members.

It looks like many of the blog “communities” are represented within the largest “community” on Twitter. Some of the Twitter communities are not represented within blogs at all. As per above – no time for the equivalent analysis within blogs.

As per centrality measure discussion earlier this indicates that Twitter and blogs networks are different. As for underlying reasons and effects of this difference – hard to say…

Application of the analysis to other educational contexts

Reflect on the possible educational contexts in which you would apply similar analysis types. Of special importance would be to identify the learning contexts that are of direct relevance to you such as work (e.g., teaching), study (e.g., courses you are taking), or research (e.g., projects). Discuss possible questions that you would be able to address in those contexts by applying the analyses used in this assignment.

Some defend evolutionary “just so stories” as valid hypothesis making – the trick is to get at the ones which can actually be falsified, and then get some hard data behind them. So for me to be believable I would like any SNA married up with multiple sources of data from the same experimental/observational set up – and across some contrasting ones.  So for example, in addition to the communication pattern data available here I would like to have access to the media use strategy in the course, characteristics of the course cohort as well as some additional data from surveys/interviews as well as participation/survival logs. Oh – and wouldn’t it be nice to have data from multiple instances of the cMOOC, perhaps with some careful variation in the baseline conditions:)

Most importantly, there should be a clear question – why are we looking for patterns here, what patterns would we expect to see? Perhaps the question could be related to aspects of social presence (as per the Community of Inquiry model) and impact of the use of Twitter vs blogs as a communication medium in a cMOOC course. Apparently, there is already an existing and validated questionnaire relating to this framework which could come in quite handy for collection of data additional to logs of social interactions:)

Oh – and I would definitely be interested in exploring any formal comparison measures/methods/statistics which facilitate multi-network comparisons and their visual presentation within SNA graphs… Just sayin’


Top image: By Tambako The Jaguar

Apologies for the look and feel

It appears that WordPress does not like me. As of couple of weeks back it started having issues with displaying side bar widgets in my chosen theme and refused to display all my posts.

I have played around with a couple of other themes and there seem to be similar issues with widget display. Unfortunately, I don’t have time to play around with it more at the moment so stuck with the most well behaved free theme for now.

So – apologies for the mess peeps. I hope to find more time soon to fix it all up…

#dalmooc wk3 homework: Twitter and blog networks in CCK11 – SNA in Gephi part 2

Feels a bit like learning finger paining...
Feels a bit like learning finger paining…

Hey – and I am back from fiddling with pretty pictures (had a bit of a pause to consider meanings of “social capital” on the way – there will be a post about that, don’t you worry!)

So Part 2 of this activity/homework was to get some visualizations going on the Twitter and blog data sets from the CCK11 (Part 1 – prelim analysis here).

Exploring layouts

I used the larger Twitter set to have a play around with the layouts.

Yinfan Hu (YH) algorithm seemed to produce a vis which pulls external nodes out/away from the centre of the vis so that they form a jagged circle. Fruchterman Reingold (FR) laid it out so that a smooth circle was created with less differentiation between sub-clusters.

YH seems to have more properties to tweak but I had no idea what some of them meant, e.g. Quadtree max level or theta (despite a handy definition tip appearing at the bottom when you click on any of them). In fact, changing values of most did not seem to have any substantial effect on the overall shape of the visualisation – at first glance anyway. Two which had most effect were relative strength and optimal distance.

  • Relative strength – The relative strength between electrical force (repulsion) and spring force (attraction). Smaller values produce tighter central cluster. If you want to see inside the central cluster – make it larger!
  • Optimal distance – the natural length of the springs. Bigger values mean nodes will be further apart. Again – if you want to see individual nodes – increase the value. To tighten individual clusters/make communities more visible make it smaller.

FR had fewer properties so was easier to understand at a first glance (area, gravity and speed). In FR lower gravity (force attracting nodes to the centre) values made the cluster less tight, making it easier to distinguish individual nodes. It took much longer to run and needed to be manually stopped.

Without use of colour to highlight modularity I found it difficult to see any structure within FR layout, so I opted for using YH method for the analysis. It seems that OpenOrd (modification of FR) would be best for detection of distinct clusters – but this must be an imported add on as I do not see it in the default layout list. Something to explore at another time:)

I also found Gephi Tutorials on Slideshare re:layout helpful:

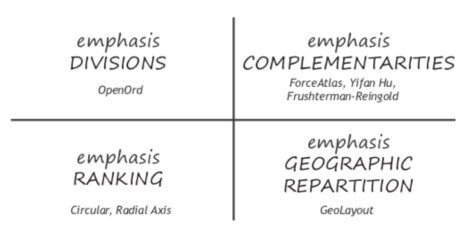
The choice of methods depends on topology you want to emphasise (also size of your network though)

LayoutMethodChoice
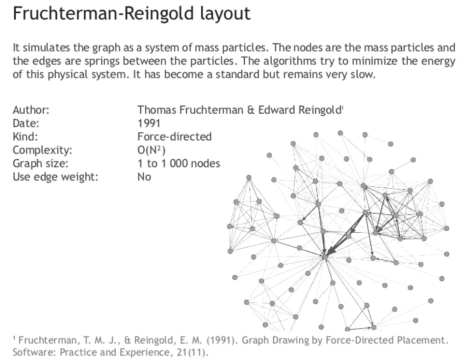
Explanation of FR method
FGLayoutHere:

  • Area = graph size area
  • Gravity = increasing gravity reduces dispersion of disconnected components by pulling them into the centre

IMPORTANT: When the algorithm does not converge – need to reduce speed to gain precision (unstable nodes position/unstable graph)

Explanation of YH method:
YHLayout
Including demystification of some of the more obscure parameters:

YHparameters
Sizing the network nodes based on centrality measures

Playing around with sizing the nodes based on their centrality measures gave a quick overview of the visual overlap between the nodes ranking highest on the different measures. For example, in Twitter network, nodes with highest values of betweeness centrality also looked like the ones with highest values of degree centrality (see below).

Size=degree centrality
Size=betweeness centrality

Ultimately I sized the nodes based on betweeness centrality and inserted the degree centrality score as a label (purely a matter of convenience as degree centrality values were just too large to fit into the node circles!).

Visualising communities identified in the networks

The tutorial suggested by Dagan – by Jen Goldbeck, was useful here although I have still not worked out how to highlight the selected nodes in the Data lab spreadsheet from the right click.

I fiddled with size range for the nodes by increasing the minimum size so that the circles are large enough to show the colours.

I also played around with modularity factor, increasing it to 2 for Twitter and to 1.8 for blogs in order to decrease the number of communities for clarity (from 12 to 8 and from 6 to 4 respectively).

I also changed some of the colours to provide better contrast between the different communities.

NOTE: any overlap in colours for Twitter and blog visualisation is accidental and does not indicate overlap in communities across these two environments.

And voilla – two pretty pictures!

CCK11BlogCommunitiesLABEL
Blog network in CCK11 course. Node size=betweeness; node label=centrality.
Twitter network in CCK11 course. Node size=betweeness, node label=degree.

What does it all mean? I think I may have to cover that in the next post – the actual Assignment for week 3 demonstrating my competencies…It will be nice to finally have some questions to answer:)

Top image source: Flickr by Maegan under CC license

Social Network Analysis basics in 300 words – #DALMOOC Assignment week 3

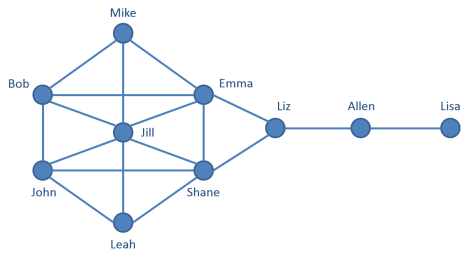
Simple social network graph example (actors=nodes; relationships=lines)

Week 3 was a useful refresher about SNA for me (after all I “successfully” completed a whole MOOC about it before;). The succinct presentation of the basic network structure and analysis was probably more useful than delving into mathematical details behind each of them – and certainly allowing to see applicability and meaning of such measures IRL settings.

Summarising it AND reflecting on it all in 300 words – that’s a bit of a challenge! But here goes it (word count starts now):

SNA aims to study relationships (e.g. communication, advice networks, hindrance) among actors that interact with one another in social networks via a combination of graphical representation and parameters describing the network structure. Dragan emphasised that, currently, SNA is the most popular form of LA.

Network elements

Each actor is represented as a node (apex) and existing relationships with others as lines (edges/ties/acs/links). Relationships can be undirected or directional, and can be weighted (e.g. by volume of exchanges).

Network measures

Connectivity of the entire network (ease of communication of information within the network):

  • Diameter – the longest distance between the pair of nodes within the network
  • Density – actual number of connections/potential number of connections

Centrality measures (identifying importance of individual actors within the network):

  • Degree centrality = overall number of actor’s connections
  • For directional networks:
    • In-degree centrality aka popularity or prestige
    • Out-degree centrality aka gregariousness
  • Betweeness centrality aka network brokers
  • Closeness centrality – shortest distance to anybody in the network for individual node

Network modularity

Analysis aimed at identification of communities within the overall social network – or groups of actors with higher density within them vs between them – and critical connectors between those communities.

Benefits of SNA

Social learning via discussion, collaboration and cooperation is currently a very popular paradigm in education and it has indeed been demonstrated to contribute to development of higher order skills such as critical thinking. Networking itself is considered an essential skill for a contemporary workplace (and they certainly want their potential employees to be able to demonstrate the ability to do it and be able to capitalise on the employees’ personal learning networks – PLNs). Applying SNA to ubiquitous data created through online interactions among learners and faculty may allow us to understand which types of online interactions are most beneficial for learning. But it should also benefit the learners directly by helping them with documentation and development of their lifelong online professional/personal learning networks.

Applications of SNA

In my experience, the richest source of Learning Analytics data within HE institutions is the institutional VLE. I had worked with distance learning postgraduate students using discussion board tools to complete discussion-based and collaborative learning activities. We provided some advice on how to effectively collaborate within such environments but this was largely based on common sense and personal experience.

SNA of discussion board interactions in correlation with student marks for the project and overall achievement could help provide better a priori advice to students in how to tackle such collaborations. Use of SNAPP tool may be a good start here.

This student cohort had minimal interactions outside the VLE, as they were not meeting f2f and shunned social media hence the data would capture majority of social interactions among the learners. This would not have been the case for the campus-based or younger cohort, where data from other social spaces,  e.g. social media, may need to be included. I believe that at most of HE institutions in the UK students do sign off on their data use for improvement of learning which would cover data collected within insitutional VLEs. Even in this case students may perceive such use as invasion of privacy and some educators see it as an unethical grooming of students into surveillance culture. The ethical and legal implications of using data from students’ personal social networks such as Facebook (even when formally used for teaching) are likely to be more complex. The EU data protection legislation makes particularly so.

End of word count. That will be around 600 words folks!

My first impression of SNA application to learning is that this is very much still a work in progress – i.e. SNA is being used for discovery/research rather than as means of routine monitoring and of effective social networking patterns for learning. Perhaps I will be proved wrong over the next week;)

Twitter and blog networks in CCK11 MOOC – SNA in Gephi part 1 for #dalmooc

Twitter vs Blog networks at CCK11 MOOC - SNA in Gephi
Twitter vs Blog networks at CCK11 MOOC – SNA in Gephi

We are onto Social Network Analysis in week 3 and now actually doing it rather than talking about it  (I am running behind, of course, as this is very much a start of week 4 now. Yikes!)

So, we were given two datasets collected during the Connectivism and Connected Knowledge MOOC in 2011, encompassing exchanges between participants on Twitter and via blogs (communication via comments). Each data set had a version collected in week 6 and week 12 of the course. The data was pre-processed into the format directly importable into Gephi (a lovely open-source and free SNA visualisation tool).

For Twitter: “graphs included all authors and mentions as nodes of the network, and the edges between them were created if an author or an account were tagged within the tweet. For example, if a course participant @Learner1 mentioned @Learner2 and @Learner3 in a tweet, then the course Twitter network would contain @Learner1, @Learner2, and @Learner3 with the following edges: @Learner1 – @Learner2, and @Learner1 – @Learner3.”

For blogs: “[graphs] included authors of the blog posts (i.e. blog owners) and the authors of the comments to individual blog posts. If a learner A1 created a blog post, and then learners B1 and C1 added comments to that post, then the corresponding network would contain nodes A1, B1, and C1 with the following edges: A1-B1, and A1-C1. All the four networks are undirected.”

The pre-processed data is only available to the course participants and its use restricted to completing our assignments so I cannot share it here.

In this analysis step I imported each set into Gephi without any glitches and performed basic analyses and filtering for each of the sets at week 12 of the  course. As per instructions this included computing the density measure and centrality measures (betweenness and degree) introduced in the course, followed by apply the Giant Component filter to filter out all the disconnected nodes and identify communities by using the modularity algorithm. Dagan’s walkthroughs in Gephi were very useful here (introduction + modularity analysis).

I report the key numbers in the table above.

It was nice to see some numbers:) And it was immediately obvious that there were some differences between Twitter and blogs, e.g. more nodes and edges in the former and twice as many “communities”.

But instantly I was concerned – what do these numbers actually mean?

Is network density of 0.003 good or bad? What does it actually mean in terms of e.g. speed of information flow in minutes/days? Has this stuff been quantified? Or is it just a matter of getting a feel for it with experience?

Or perhaps it only works for comparisons? If so – how do I tell if the difference in network density between Twitter and blogs (0.003 vs 0.01, respectively) is actually significant? And would this significant difference in a network measure value have any meaningful effect on the ease information flow within each network?

Clearly, still a lot to learn. Onto making some pretty pictures (oh – sorry – visualisations;) with the said data for part 2 of this task. Won’t be long I hope:)

Getting to grips with educational data sources in the UK – and the NSS mini-case study

Where do I even start?

Skipping ahead to week 2 of #DALMOOC and some data wrangling. In one of the assignments (assignment56) George Siemens challenged us to go forth and find some educational data…so I did.

I am not embedded within an institution at the moment (and even if I were, I’d imagine there would be ethical/legal issues in exposing institutional data like this, even with aggregation/anonimisation). So I had to go foraging for some publicly available sources.

There were some suggestions from George Siemens – covering the US and the world:

Of course, at that level the data really speaks more to the academic analytics level – looking at student demographics, institution or programme completion rates, fees, staff-student ratios etc. Not as exciting as getting to the nitty-gritty of learning but will have to do!

At that level the data is also heavily summarised and aggregated so the opportunities to drill down for your own analysis are limited.

Never for making it easy for myself, I thought I’d have a wee look at the data sources available locally, in the UK.

For a novice like me, it was a bit of a challenge…

Thankfully, I came across some “data journalism” blogs with handy advice:

UK data service provides centralised Discover portal to number of education-related data sets, including the international ones (e.g. OECD or EU-based).
There is also the brand new and so far limited but rather ambitious data.ac.uk aimed at aggregating openly available HE education data (thanks to helpmeinvestigateeducation and Tony Hirst for pointing me to this source).
Rather than seeing what’s there, I decided to look for a particular data set – National Student Survey. The survey started in 2005 or so and was aimed at documenting student satisfaction with their courses at their graduation, using a very simple questionnaire (PDF). It started in England but now extends to some Scottish institutions in my own backyard. Seemed like a great idea to give university applicants some simple info on quality of teaching. But it has been causing quite a controversy, especially when some more esteemed establishments within the Russell Group Universities scored close to the bottom of the rankings on the quality of student feedback. There was much grumbling about methodology of course (some of it justified) but also institutional action to address the shortcomings in assessment strategies (or students’ perceptions of feedback).
I thought it would be fun to see how the Russel Group is doing these days:)
I found it in two places: at HEFCE website in simple, poorly documented Excel spreadsheets and via HESA in a more aggregate format as a part of a wider and well documented XML data set underlying Unistats website (the latter includes data on student retention, salaries, careers, staff/support etc.).
I went for HEFCE dataset from 2013 (2013 NSS results by teaching institution for all institutions). It was in a familiar Excel format and much of it in “human” easily understandable language. The results were granular to subject area/degree within each institution. There were some clean-up/reformatting required but it was likely to be minimal (I think I will write about it in another post).
I thought it would be neat to use a map for some of the visualisations (who doesn’t love a map;). Geolocation data for the institutions was missing from NSS HEFCE data – but data.ac.uk came to the rescue here with their list of registered learning providers. They even threw in institutional groupings (e.g. Russell group etc.) for good measure (see augmented data set). Both sets included UKRLP code which should make for an easy join.

HEFCE set only contained question numbers so I needed to create another table containing question text as well as the evaluated course aspect – and I used the exemplar questionnaire from NSS website as an input here. I would use question number as a join with the NSS set.

Phew – it was rather hard work all this rummaging for data. And this is even before the clean up and playing around with it in Tableau!

What I learned:
  • much of the data (especially in the less aggregated and more valuable format) is available via subscription only to the members of educational institutions (e.g. HEIDI or Discover portal)
  • some of the databases have in-built interactive visualisation tools, e.g. Discover
  • each dataset has their own terms and conditions for use – you must read (or click through) a lot of bumph even before you get started, especially on portals aggregating datasets across sources!
  • data derived from the same data collection exercise can often be found via different sources varying in degree of aggregation, data integration and documentation – it looks like it is worth looking around for something that fits your needs
  • getting to know well documented and structured data can be hard work, especially for a database novice like me (labels etc. are rarely written in human-readable language and you have to digest a lot of definitions)
  • it is likely that you will have to find more than one data source to cover all the aspects you need for your analysis
  • Even highly curated data sets may need some clean up

Image source: Flickr by ttcopley under CC license

What is Learning Analytics and what can it ever do for me?

Putting up definitional fences and looking for connections.
Putting up definitional fences and looking for connections

#DALMOOC’s week 1 competency 1.2 gave me an excuse explore some definitions.

As a scientist, the insistence on using the term “analytics” as opposed to “analysis” I found intriguing…The trusty Wikipedia explained that analytics is “the discovery and communication of meaningful patterns in data” and has its roots in business. It is something wider (but not necessarily deeper) than data analysis/statistics as I am used to. Much of it is focused on visualisation to support decision-making based on large and dynamic datasets – I imagine producing visually appealing and convincing powerpoint slides for your executive meeting would be one potential application…

I was glad to discover that there are some voices out there which share my concern over the seductive powers of attractive and simple images (and metrics) – here is a discussion of LA validity on the EU-funded LACE project website; and who has not heard about the issues with Purdue’s Course Signals retention predictions? Yet makers of tools such as Tableau (used in week 2 of this course) emphasise how little expertise one needs to use them to look at the data via the “visual windows”… The old statistical adage still holds – “garbage in – garbage out” (even though some evangelists might claim that in the era of big data statistics itself might be dead;). That’s enough of the precautionary rant…;)

I liked McNeill and co.’s choice of Cooper’s definition of analytics in their 2014 learning analytics paper (much of it based on CETIS LA review series):

Analytics is the process of developing actionable insights through problem definition and the application of statistical models and analysis against existing and/or simulated future data (my emphasis)

It includes the crucial step in looking at any data in applied contexts – simply asking yourself what you want to find out and change as a result of looking at it (the “problem definition”). And the “actionable insights” – a rather offensive management speak to my ears – but nonetheless doing something about it seems rather an essential step in closing any learning loop.

The, currently, official definition of Learning Analytics came out of an open online course in Learning and Knowledge Analytics 2011 and was presented at the 1st LAK conference (Clow, 2013):

“LA is the measurement, collection, analysis and reporting of data about learners and their contexts, for purposes of understanding and optimising learning and the environments in which it occurs.”

This is the definition used in the course – the definition we are encouraged to examine and redefine as this very freshly minted field is dynamically changing its shape.

Instantly I liked how the definition is open on two fronts (although that openness seems to be largely in the realm of aspirations than IRL practice, but is not surprising, given the definition’s origins):

1. It does not restrict data collection to the digital traces left by the student within Learning Management Systems/Virtual Learning Environments so it remains open to data from entirely non-digital contexts. Although in reality, the field really grew out of and, from what I can see, largely remains in the realm of big data generated by ‘clicks’ (whether it be VLEs or games or intelligent tutoring systems). The whole point really is that it relies on data collected effortlessly (or economically) – compared to traditional sources of educational data, such as exams. What really sent a chill down my spine is the idea fleetingly mentioned by George Siemens in his intro lecture for this week – extending the reach outside of the virtual spaces via wearable tech…. So as I participate in the course I will be looking out for examples of marrying the data from different sources. I will also look out for dangers/side effects of focusing on what can be measured rather than what should be measured. I feel that the latter may be enhanced by limiting a range of perspectives involved in development and application of LA (to LA experts and institutional administrators). So keeping an eye out for collaborative work on defining metrics/useful data between LA and educational experts/practitioners, and maybe even LDs is also on the list (Found one neat example already via LACE SOLAR flare UK meet, which nicely coincided with week 1 –  Patricia Charlton speaks for 3 min about the mc2 project starting at 4.40 min. The project helps educators to articulate many implicit measures used to judge student’s mathematical creativity. Wow – on so many levels!).

2. It is open to who is in control of data collection (or ownership) and use – institution vs the educator and the learner. I was going to say something clever here as well but it’s been so long since I started this post, it’s all gone out of my head (or just moved on). I found another quote from McNeill and co., what is relevant here:

Different institutional stakeholders may have very different motivations for employing analytics and, in some instances, the needs of one group of stakeholders, e.g. individual learners, may be in conflict with the needs of other stakeholders, e.g. managers and administrators.

It sort of touches on what I said under point 1 – need for collaboration within an institution when applying LA. But it also highlights the students as voices of importance in LA metric development and application. It is their data after all so they should be able to see it (and not just give permission for others to use it) and they are supposed to learn how to self-regulate their learning and all…Will I be able to see many IRL examples of such tools made available to students and individual lecturers (beyond the simple warning systems for failing students such as Course Signals)? There was a glimmer of hope for this from a couple of LACE SoLAR flare presentations. Geoffrey Bonin talked about Pericles project and how it is working to provide a recommendation system for open resources in students’ personal learning environments (at 1 min here). Or rather more radical, Marcus Elliot (Uni of Lincoln) working on a Weapons of Mass Education project to develop a student organiser app going beyond institution giving students access to the digested data and involving research project around student perceptions around learning analytics and what institutional and student-collected data they find most useful – data analytics with students not for students (at 25 min here).

(I found Doug Clow’s analysis of LA in UK HE re: institutional politics and power play in learning very helpful here and it was such a pleasant surprise to hear him speak in person at the LACE Solar flare event!)

The team’s perspective on the LA definition was presented in the weekly hangout (not surprisingly, everybody had their own flavour to add) – apologies for any transcription/interpretation errors:

  • Carolyn (the text miner of forums): Defined LA as different to other forms of Data Mining as focussing on the learning process and learner’s experiences. Highlighted the importance of correct representation of the data/type of data captured for the analysis to be meaningful in this context vs e.g. general social behaviours.
  • Dragan (social interaction/learning explorer): LA is something that helps us understand and optimise learning and is an extension (or perhaps replacement) of the existing things that are done in education and research, e.g. end of semester questionnaires no longer necessary as can see all ‘on the go’. Prediction of student success is one of the main focuses of LA but it is more subtle – aimed at personalising learning support for success of each individual.
  • Ryan (the hard-core data miner who came to the DM table waaay ahead of the first SOLAR meet in 2011, his seminal 2009 paper on EDM is here):  LA is figuring out what we can learn about learners, learning and settings they are learning in to try to make it better. LA is about beyond providing automated responses to students but LA also focuses on including stakeholders (students, teachers and others) in communication of the findings to them.

So – a lot of insistence on focus on learners and learning…implying that there are in fact some other analytics foci in education. I just HAD TO have a little peak at the literature around the history of this field to better understand the context and hence the focus of the LA itself (master of procrastination reporting for duty!).

Since I have gone beyond the word count that any sensible co-learner may be expected to read, I will use a couple of images which do illustrate key points rather more concisely.

Long and Siemens’ Penetrating the fog – analytics in learning and education provides a useful differentiation between learning analytics and academic analytics, the latter being closer to business intelligence at the insititutional level (this roughly maps onto the hierarchical definition of analytics in education by Buckingham and Shum in their UNESCO paper – PDF):

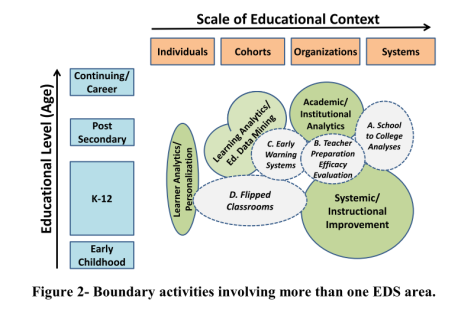
Learning Analytics vs Academic AnalyticsI appreciate the importance of such “territorial” subject definitions, especially in such an emerging field, with the potential of being kidnapped by educational economic efficiency agenda prevailing these days. However, having had an experience of running courses within HE institutions, I feel that student experience and learning can be equally impacted by BOTH, the institutional administration processes/policy decisions AND the quality of teaching,course design and content. So I believe that joined up thinking across analytics “solutions” at all the scales should really be the holy grail here (however unrealistic;). After all there is much overlap in how the same data can be used at the different scales already. For that reason I like the idea of unified concept of Educational Data Sciences, with 4 subfields, as proposed by Piety, Hickey and Bishop in Educational data sciences – framing emergent practices for analytics of learning organisations and systems (PDF). With one proviso – it is heavily US-focused, esp at >institution level. (NOTE that the authors consider Learning Analytics and Educational Data Mining to belong in a single bucket. My own grip on the distinction between the two is still quite shaky – perhaps discussion for another post)

educationaldataanalysistaxonomyI would not like to commit myself to a revised LA definition yet – I shall return to it at the end of the course (should I survive that long) to try to integrate all the tasty tidbits I collect on the way.

Hmm – what was the assignment for week 1 again? Ah – the LA software spreadsheet….oops better get onto adding some bits to that:)


Headline image source: Flickr by Pat Dalton under CC license.

Treating myself to the dual layers of #DALMOOC with EdX

Big data's brotherly gazeJust as I was thinking of getting back to the founts of MOOCy goodness last week, Twitterous serendipity occurred yet again and voila, I am now enrolled on the Data Analytics and Learning course from Texas University Arlington via EdX’s Honour Code route no less. The course proper does not commence until Monday (so still time to follow me in;) but we’ve already been treated to some induction materials over the weekend…(Available separately on G+ and YouTube).

My discerning MOOCer palate has been tempted this time for two reasons:

  • I find institutional/governmental  collection of vast amounts of personal data and their use of data analytics to “improve my experience” extremely creepy – in a Big Brother 1984 way. If you know me from PLN seminar, you know my tendency for such doomsday scenarios;). But I am also a (recovering)scientists and so it is almost impossible for me to refuse a chance to play with some numbers and new analytical tools.
  • The MOOC design itself is intriguing – very explicitly trying to combine the more usual, linear xMOOC paradigm with the more open, social-learning-focused cMOOC. I have sampled a range of courses aiming for a version of the latter, so again I could not resist having a taste here. Especially that these guys are trying out some new tools to facilitate social interaction within both models. Oh – and since the “social learning” aficionado (and, apparently, also a learning data analytics guru), George Siemens (@gsiemens) , is the lead here, we are guaranteed an interesting ride!

In the words of the man himself (there will no doubt be more words on the topic on his elearnspace blog here):

“I think that in the MOOC landscape we too prematurely settled on the instructional model that we have and we really want to take an opportunity with this course to ask a range of questions and experiment with different ways of making learning happen in different contexts. So we are experimenting with social learning, with different support structures and software…” (DALMOOC Induction video 1)

Shouldn’t forget George’s collaborators on the project:

  • Carolyn Rose of Carnegie Melon Institute (innovator in such funky topic as Automated Analysis of Collaborative Learning Processes and Dynamic Support for Collaborative Learning and the person behind Bazaar and Quick Helper support system implementation within the course’s structured EdX platform. Having had designed and supported collaborative work online before – this is certainly of interest to me:)
  • Dragan Gasevic (@dgasevic) of Athabasca University (into applying semantic web principles to elearning systems and a father to the newly minted “credentialing pipeline” Prosolo tool to be used in the social layer of the course)
  • Ryan Baker (@BakerEDMLab) of Columbia University (looking at data mining intersection with human-computer interaction, and seemingly particularly interested in student’s motivation, or rather lack thereof, e.g. “WTF behaviour”, in the interaction with elearning systems).

The induction materials so far have been heavily focused on showing us around the dual layer course model and the introduction to the learning tools expanding the usual EdX set of forums and videos.

DALMOOC Visual SyllabusCentral to this introduction is “visual syllabus” designed as an intuitive overview of the complex course design and an introduction to the less-traditional social learning layer of the course by Matt Crosslin (@grandeped) of LINK Research Lab. Great idea but perhaps needs a tweak or two:

  • Less emphasis on esthetics of the design and more on information – e.g. including header text alongside more informative images so that we actually do get an overview without having to roll over pics?
  • As Matt explains in the induction hangout, the aim is to particularly focus on introducing the non-traditional, unstructured, “social learning” layer of the course, getting away from assumptions of learner’s zero prior knowledge at the point of entry. Yet the learner’s progress through the overview is highly structured through the prominent numbering of the sections, therefore falling back onto the traditional paradigm and assumptions of linear progress through materials. Adding text headers, even alongside the numbers, would instantly change this first impression and allow for choice of point of entry, especially for those learners who have already dabbled in non-traditional courses before;)

A brief comment on the first impressions of the tools we are going to be using to support our learning:

  • In the structured/linear layer (the blue pill) we have a couple of tools, Quick Helper and Bazaar, which seem to target the usual problem with massive courses – the sheer volume of people and messages and lack of more intimate collaborative learning experience which in f2f sessions may be achieved by simply turning to your neighbour in the classroom. Both are using automation, text analysis and algorithmic approaches to facilitate interactions. My immediate reaction (and some of my colleagues I discussed this with) is that while the tools may indeed help those students with less sophisticated online collaboration skills to find support within the EdX system, they do nothing for their online networking skill development. A couple more specific issues with each. Quick Helper’s “help matching intervention” system of targeting your forum questions to specific students/helpers may result in undue workload for students algorithm deems “an expert” and resentment if help is not provided (perhaps allow people to opt out/into the helper role?). Bazaar allows for spontaneous creation of collaborative/discussion groups, discussion aided by “virtual agent”. As @gsiemens pointed out in the induction hangout – it is a bit like Chatroulette, but with less nudity…Well, the analogy pretty much says it all.
  • So – not that excited about the aids to the structured layer of the course but then, I usually tend to live outside the course VLEs anyway, in the red pill territory. The course’s expectation of setting up and using our own learning and networking spaces is more up my alley:) and I am a bit excited about using the prototype of “credentialing pipeline”, Prosolo, which is supposed to help us create, share and assess each others’ artifacts and form interest networks.

More on the course design etc. from the horses’ mouths:

Now – despite all this “constructive criticism” – I do look forward to taking part. No doubt I will be pleasantly surprised…off to try my hand at the educational Chatroulette:)

Image source: Diodoro under CC license

The PLN promise can turn your organisation into the house of horrors

PLN house of horrors

Week 3 and 4 in Exploring PLN Seminar (and maybe even week 5…)

This post is aimed to be a quick wrap-around my #xplrpln artifact (you can find it on Prezi) we were invited create in response to a set scenario and share it with others this week.

Yes, it is covering two weeks of the seminar (and I am posting it in week 5!). This is not because I have become disengaged or too busy. It is because the few readings on PLNs and organisations provided by Jeff and Kimberley in week 3, along with the seminar participant contributions needed some solitary rumination before I could spit the chewed cud back into the communal fermentation vat (help! – I seem to be losing control over my metaphors…).

Among all the rumination around the topic I was also struggling with the idea of the CEO pitch. This is not the first time that my allergy to corporate/managerial context has surfaced. One of the reasons I quit the Open University’s #H817 Openness and Innovation in eLearning course earlier this year was the large chunk of the assessment based on presenting business cases. I understand why – it’s important to make such courses relevant to practitioners via authentic/applied assessment. Perhaps it is something about the executive language? Perhaps it is the difficulty of putting myslef in the CEOs or large organisations’ shoes (I keep thinking that the bottom line for them is really just financial gain – even in educational institutions these days)? Perhaps it is the disenchantment with such organisations and their cultures? Or simply the lack of sense of play and fun in learning from such artifact?

On the other hand, perhaps I started to expect an inspiration to push beyond institutional/established mindsets in my ‘learning experiences’. To be encouraged to explore different ways of representing and applying my understanding. This is one of the thing that cMOOCs taught me (although in fact it was probably seeded long time ago when I heard about learning in the open and digital artifact-based assessment approaches taken by the University of Edinburgh’s MSc in Online Education).

I did try to take on a challenge of getting it done, finding a “professional” voice. But simply couldn’t force myself to go there. Thankfully – this learning experience, unlike the caged OU course, was not prescriptive. I enjoyed crystallizing my ideas around the potential institutional horrors of ‘implementing’ PLN approaches at universities – large, complex and culturally diverse organisations. I did try to entertain the audience as well. Including the imaginary HE leaders and, the very tangible, fellow #xplrpln-ers alike. While making us laugh I was hoping to make us all more thoughtful before we rush into implementation of the new PLN and related ideas at a massive scale. At institutional and Profersonal(TM) levels.

My ruminatory state sharpened my attention to examples of organisational PLN horrors in my recent PLN data stream – I tried to include those alongside the insights from the course readings. These anecdotes turned it from a theoretical to a very much real-life tale…and also illustrated the ongoing/dynamic nature of the beast. Changes in technology, terms and conditions will keep coming, and we have to, personally and institutionally, keep reconsidering the cost/benefit equation for PLNs or specific technical solutions which may enhance/detract from it.

Why the horror angle? I thought a lot of the PLN-related hype is coming from businesses who have much to gain from organisations and individuals engaging with the services they offer – either as paid for SNA /social intranets/social enterprise solutions for organisations or by getting hold of our very much monetisable data, including our personal or professional network interactions via their ‘free’ social media services (we have all heard the now well worn warning “when you are not a customer you are a product”). Organisations implementing social learning solutions may also have less than altruistic ideas at heart. I thought an antidote to the seductive murmur of the Sirens was in order:) Oh – and it *was* Halloween…

Just in case I don’t find time for more reflection around #xplrpln here, I would like to say now that I am extremely grateful to Kimberley and Jeff for putting this seminar together and to the co-participant for diving in (or even just watching). It has been a great adventure!

Lessons learned and unlearned